Context: SchoolData visualisation2023
MusicGate
One-page interactive visualisation of a class's music habits, in Spotify-like themes.

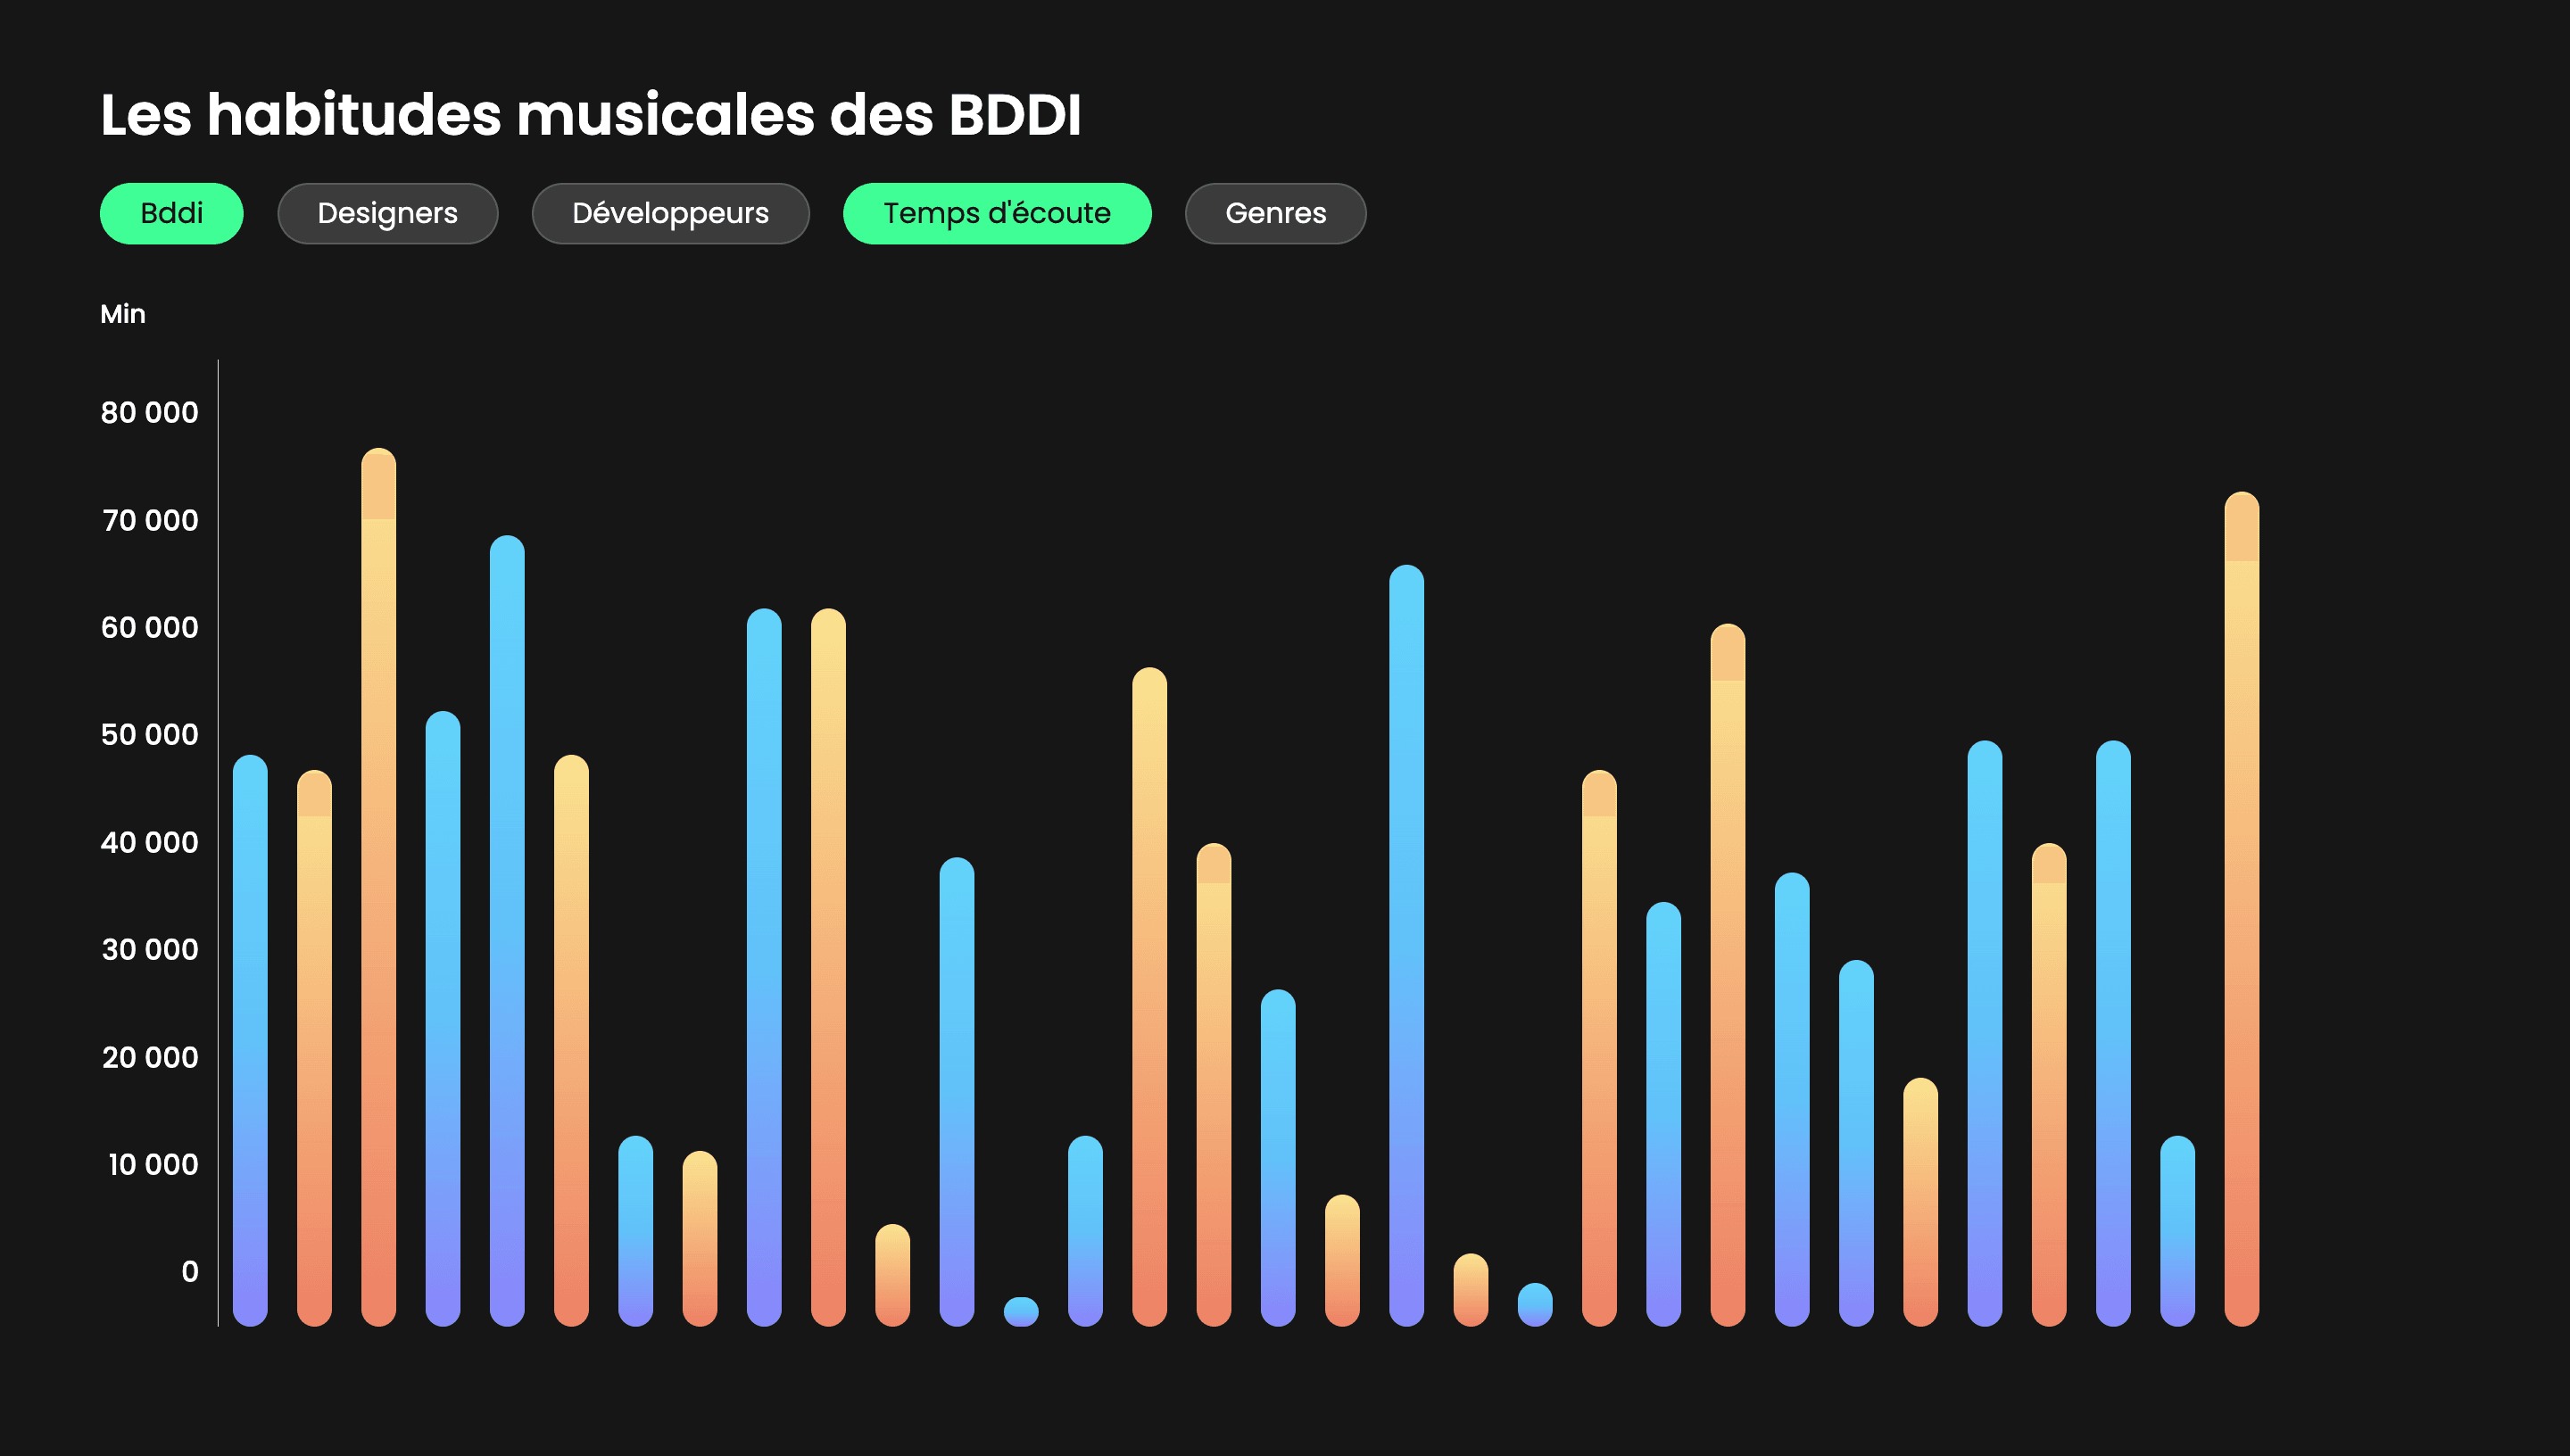
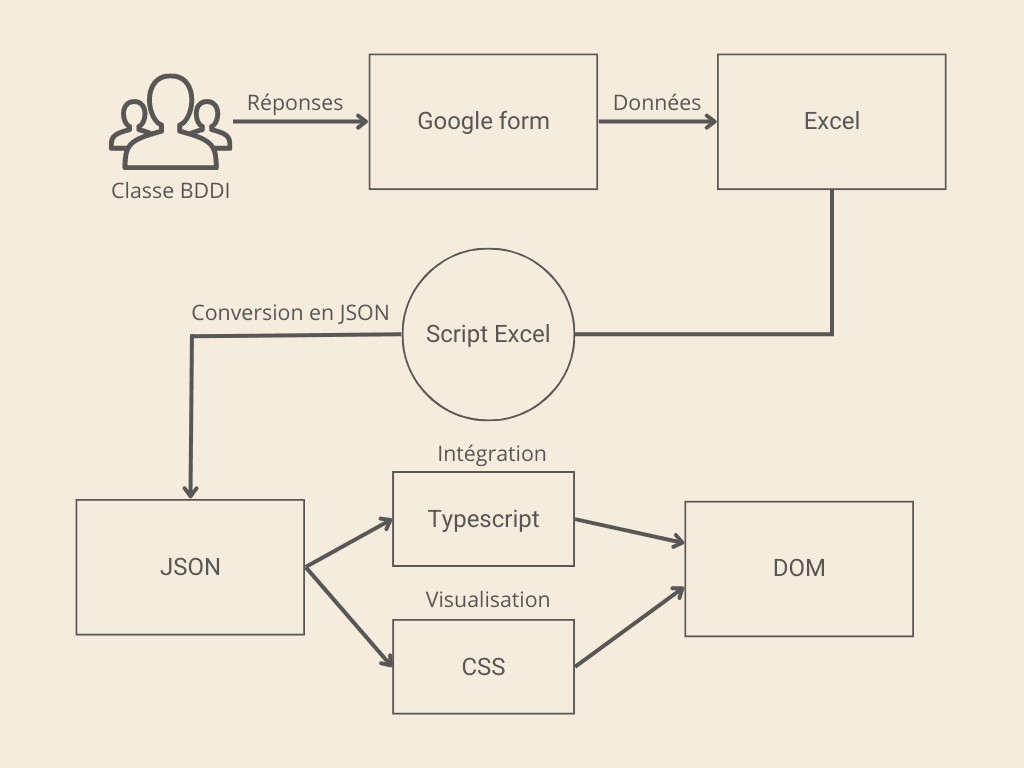
Image 1 of 2
- Year
- 2023
- Type
- Data visualisation
- Stack
- TypeScript
- HTML
- CSS
- JSON
- Classes
- Developer
About the project
MusicGate turns the music habits of the BDDI class, designers and developers together, into a single scrolling page of interactive charts.
Visitors compare listening time and favourite genres, and filter the data by group to see how designers and developers differ. Each section has its own colour theme, inspired by Spotify's visual language.
The data comes from a Google Form answered by the class, exported to Excel and converted to JSON by a script. TypeScript then integrates it into the DOM, and the charts themselves are drawn in CSS.
Key points
- Interactive charts with filters by group and metric
- Data pipeline from form answers to JSON
- Charts drawn in CSS from typed data
- Themed sections as a small visual system